Before I start, I want to make it clear that any use of this
information to design your own car is done at your own risk. I take no responsibility for anything you
choose to do with this data. If your car
doesn’t work the way you want it to, that’s not my fault! Okay, with that behind me let’s get into it.
I am still waiting on my motor adapter plate to get
finished, so progress is still slow. In
the meantime, here’s some info on motor performance that might be interesting
to you. Before I jumped into this project,
I wanted to have a good prediction of the performance I would be getting. I didn’t want to start driving and realize I
should have started with a different car, motor, battery pack, controller, or anything else. One very important piece to
that puzzle is knowing how much torque you can get out of your motor. More importantly, I needed a torque-speed
curve. I’m only going to discuss the
WarP 9 here, but I looked at a few other motors as well (mentioned in my last
post).
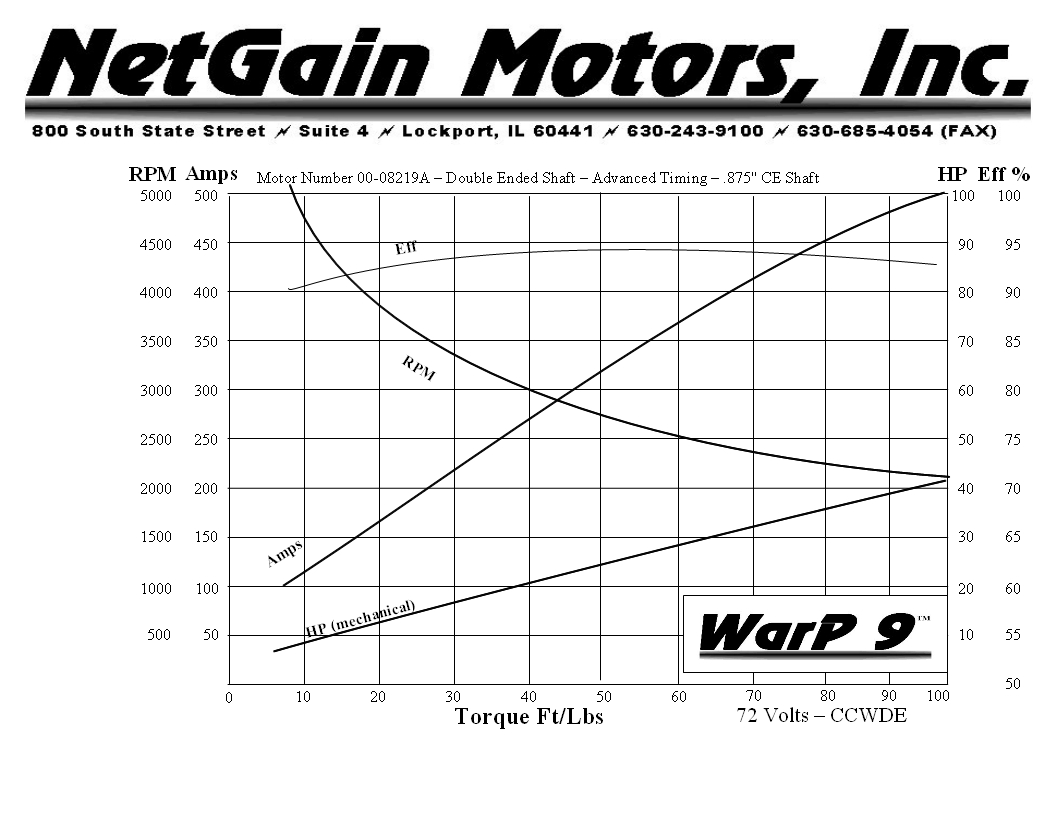
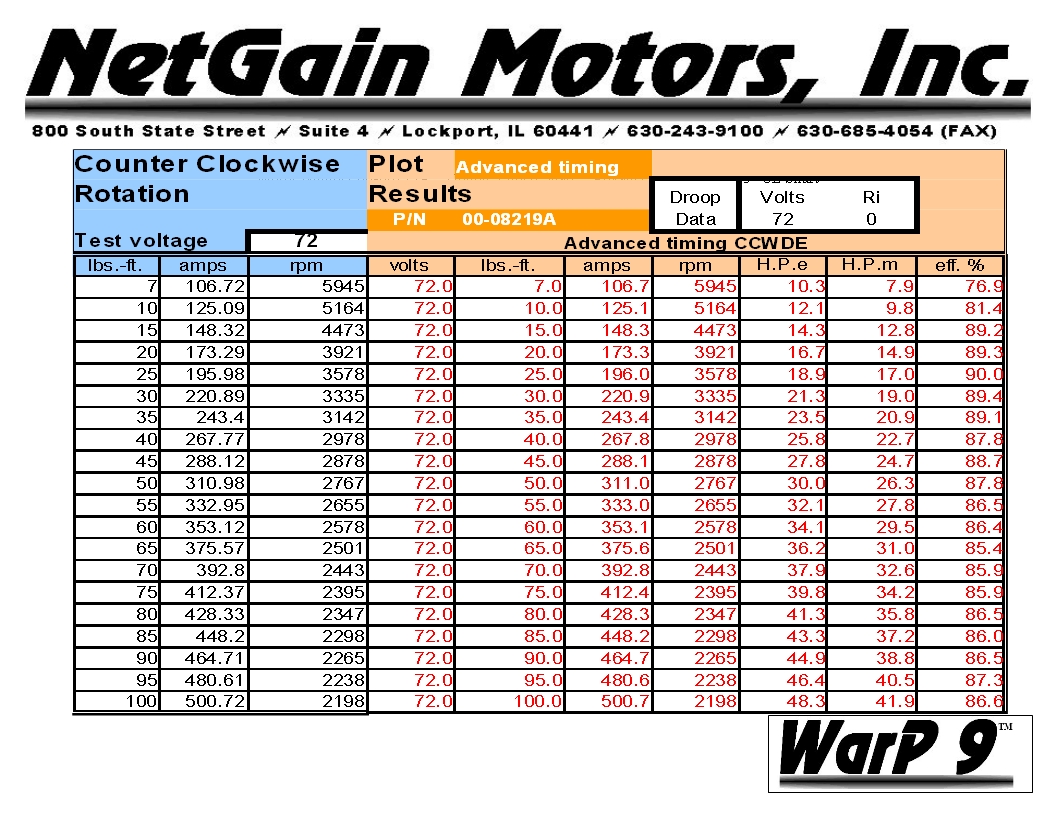
Netgain’s website has a lot of these charts and tables available
for you to use. Here are the links for
the WarP 9 data for motors manufactured after 7/1/10.
Unfortunately, the data only goes up to 500 amps. For a lot of people, this is entirely
adequate since they have a controller rated for 500 amps output to the
motor. If you intend to drag race, that’s
not going to cut it. Electric drag
racers commonly run 1000-2000 amps through their motors to get more torque. So how do you figure out how much torque you’re
going to get beyond 500 amps? There is a
common rule for series wound motors that says the torque is proportional to the
current squared. The equation looks like
this:
Torque = Constant x Current^2
From Netain’s data, at 500 amps you get 100 ft-lb of
torque. Using that data point, the
constant can be calculated to be 0.0004, so now you get this equation:
Torque = 0.0004 x Current^2
Let’s say you want to know the torque output at 1000
amps. With that equation, you would
predict 400 ft-lbf…sweet! Too bad that’s
not what really happens.
Okay, if you plot out the data, it looks like a fairly
straight line, so let’s just use the slope of the last two data points and see
what happens. You get a linear
relationship that looks like this:
Torque = 0.2486 x Current – 24.3
Using this relationship, at 1000 amps you would predict 224
ft-lbf. Unfortunately, you can’t count
on that either. So why can’t we use
either of these methods? Well you can if
you aren’t extrapolating the data too far from the actual data, but doubling
the range is out of the question. The
problem is called saturation. First let’s
discuss how a motor works.
Inside the motor you essentially have electromagnets. When you were a kid, did you ever wrap wire
around a nail and hook it to a 9v battery to pick up paper clips? The force coming from an electromagnet is
proportional to the number of turns (windings around the nail) multiplied by
the current going through the wire.
Since a series wound motor uses electromagnets for the stator and the
rotor, you get a force proportional to the current squared. But you can’t just keep increasing the
current and expect the square relationship to continue indefinitely.
When you apply current, you create a magnetic field. Anything made of iron has low permeability,
meaning the field flows easily through it…sounds like something from Star Wars. But it can only flow so much. Similar to a garden hose, at some point,
opening the valve more doesn’t produce any more water flow. This phenomenon in the electromagnetic world
is called saturation. Certain areas of
the iron core used in the motor’s rotor and stator will start to saturate as
the field is increased. At this point,
the magnetic field (or flux) will have to find another path, which is probably
through air. If it doesn’t pass through
the iron, you don’t get usable force out of it.
Eventually the entire part will become saturated and no matter how much
current you apply, the force will not go up any more. Okay, enough with the physics lesson. This is what I did to solve the problem.
I decided that the saturation could be accounted for by
making the exponent in my first equation a variable instead of a constant. That variable should be a function of current
and inversely proportional to it (i.e. it decays with higher current). I found a few bits of data on the internet for
current above 500 amps and fit it in with the Netgain data. The result looks like this:
Torque = Flux Constant x Current^Exp
Exp = 2.0615 – 0.0002 x Current
Flux Constant = 0.00051
This is the result. You can see that the equation fits the Netgain
data fairly well, and as would be expected, the slope gets lower as the current
gets higher. If anyone out there has
good data on the current WarP 9 motor, please let me know and I can use it to
enhance this graph. You can also see
from this graph that using the squared rule does not fit the data well at all.

The next piece of the puzzle is the torque speed curve. Why do I need to know this you ask? Well this tells us how fast the motor will
spin with a given voltage and current.
You can use it in a variety of ways.
Let’s say you know you need 50 ft-lbf of torque to climb a hill in a
certain gear and you want to do it at 50 mph.
You could look at this graph and determine how much voltage you need to
supply to the motor to achieve this.
From a different angle, if you want to know how long you will have your
maximum torque in a certain gear, you can use this chart to determine that as
well. Again, we want to extrapolate this
data beyond the range of what’s provided by Netgain.
We’ll start with the governing equation. It is commonly accepted that RPM, Voltage,
and Current are related with this equation:
RPM = K x Voltage / Current
where K is the motor constant. If you use this equation to calculate K for
the Netgain data, you will find out that K is, in fact, not a constant. If you plot K versus Current, you will find
that the relationship is fairly linear.
That means we can easily calculate K as a function of current. I found that the data matches a little better
if you split it in two sections and use a linear relationship for K above 300
amps and a polynomial relationship less than 300 amps. You can see the curve fits in the following chart.

From this, we can get the following equation for K:
K = -0.00006 x I^3 + 0.0809 x I^2 – 9.3578 x I + 8982.3 For I < 300 Amps
K = 17.69 x I + 6404.8 For
I > 300 Amps
In the next chart I’m comparing the actual data with the
calculated data and you can see it fits quite well.

From here you can extrapolate even further and create curves
for various voltages.

And now I'm ready to make my performance predictions.
Fantastic info on Motor choice!! Great blog, i'll be following this!!
ReplyDeleteThis comment has been removed by the author.
ReplyDeleteThank you so much for this information! It has helped a lot with my decisions for pack voltage, current, etc. for my own build...
ReplyDelete